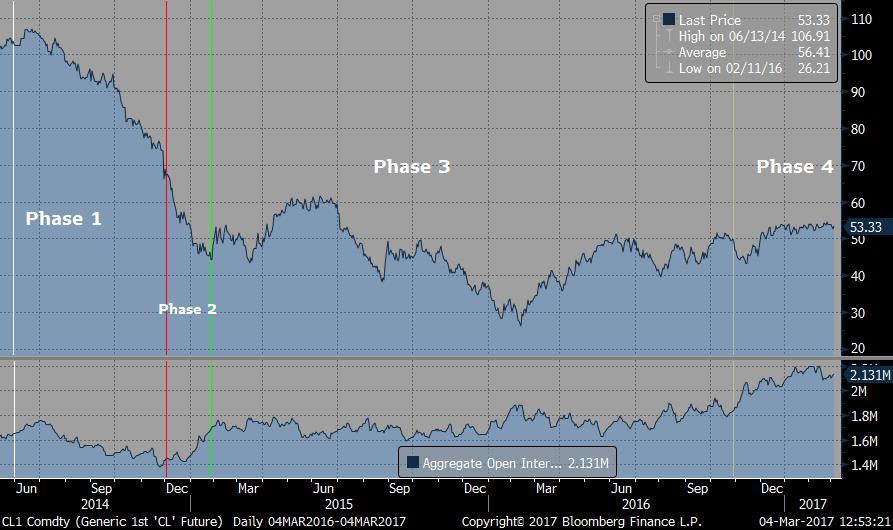
We start by looking at changes in total open interest in WTI futures since the beginning of the decline in June 2014. We decided to break the market cycle into four phases. The chart below shows the front-month futures price in the upper panel, and the aggregate open interest for all contract months in the lower panel.
A quick summary of the cycle so far:
Phase 1: Open interest declined from 06/01/14 to 11/30/14, by 220K contracts. Prices dropped from the low 100’s to about $70/bbl.
Phase 2: The drop in open interest observed in Phase 1 was abruptly reversed and open interest increased by 280k contracts. Prices continued to drop from $70 to the high $40s. We characterize this phase as lasting between 12/01/14 to 01/30/15.
Phase 3: Between 02/01/15 and 10/31/16, the market open interest largely remained rangebound increasing only 155K and prices remained in a range between $30 and $60/bbl. While this might seem like a large change in OI and wide price range, over the extended time period the rates of change of both prices and open interest are very low.
Phase 4: This began on 11/01/16 and continues to the time of this writing. Open interest increased by 260K and prices moved from the mid $40s to the mid $50/bbl area.
We then analyzed the CFTC Commitment of traders (COT) data for each period, and studied the major changes in positioning. We did adjust the data a little to better suit our framework of looking at the markets. We also made the following assumptions:
- We began by assuming that any changes in commercial crude oil inventories were immediately hedged by inventory holders. We also assumed that all these storage operators would be already be carrying short positions, as they would either be producers or tank operators, and be captured in the Commercial short category on the commitment of traders report.
- We assume that commercial shorts includes both tank hedgers discussed above as well as some producer hedges that were not executed at banks.
- We assume that swap dealers also include producer hedges executed via over the counter deals with banks.
- We assume that the combination of managed money and the other categories represented hedge funds and other speculative money in the market.
- We assumed that ETF issuers that issue a short exposure ETF also issued a long ETF and are able to net the futures positions between the two issues.
- We assumed that the ETF issuers would place their corresponding futures holdings at a custodian which would be labeled as a swap dealer.
- In our analysis we assume that ETF flows were only captured in the Swap Dealer short category, as most of these custodians maintain large oil trading groups and producer hedge books, and would already be carrying large short futures positions against these over the counter deals.
Phase 1

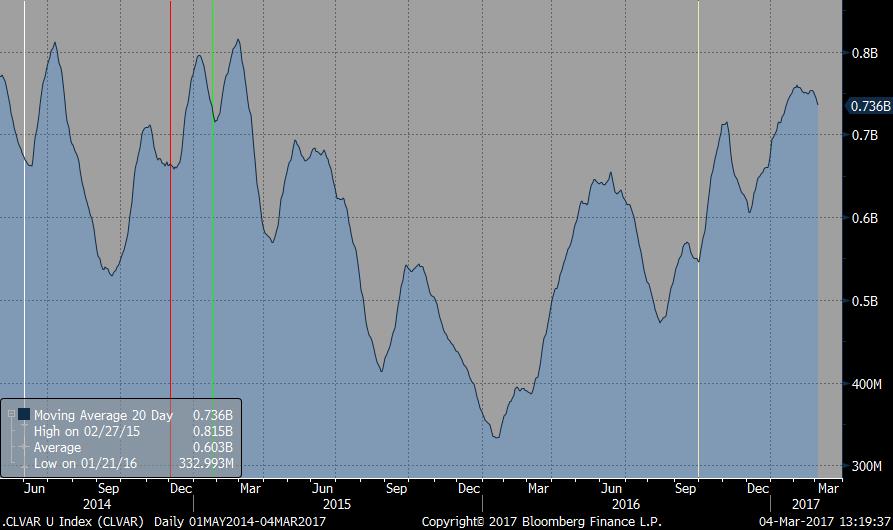
During Phase 1, the largest flow was hedge funds exiting long positions, being matched up with swap dealers exiting short positions. This liquidation on both sides combined with commercial shorts reducing hedges led to the large decrease in open interest. It is interesting that because of the increase in volatility in this period, some approximation of the total VAR (chart below) of the hedge fund position was essentially unchanged, despite the large liquidation. This also suggests this was a forced liquidation as risk limits were breached by the increased volatility.
We recall at the time, there were expectations in the market of an OPEC cut, given the price decline. A few high profile producers had started to buy their hedges back. This combined with consumers such as airlines hedging was probably drove down the positioning in this swap dealer short category.
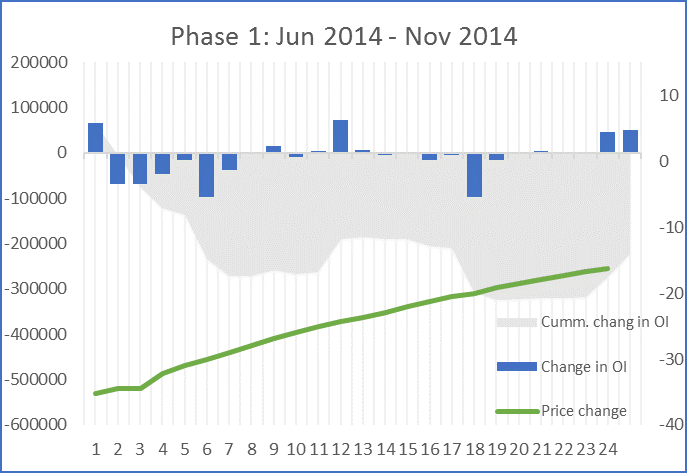
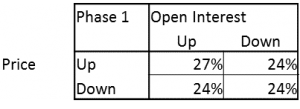
Looking at the chart below, we see that open interest decrease was concentrated in the first 6-7 contracts, consistent with short dated hedges and hedge fund positions being liquidated. The market was also pretty balanced between the two flows with equal numbers of days in each quadrant in the open interest/price table below.
Phase 2
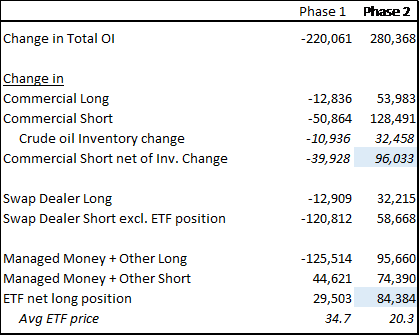
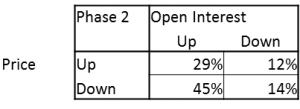
Phase 2 was an eventful period, even though it only lasted 2 months. There was a lot of trading and some large principal risk exchange, where open interest increased very quickly. The primary flow was commercials selling to ETF buyers. There were a large proportion of days where open interest increased as prices moved lower, suggesting that commercials were aggressors and price insensitive.
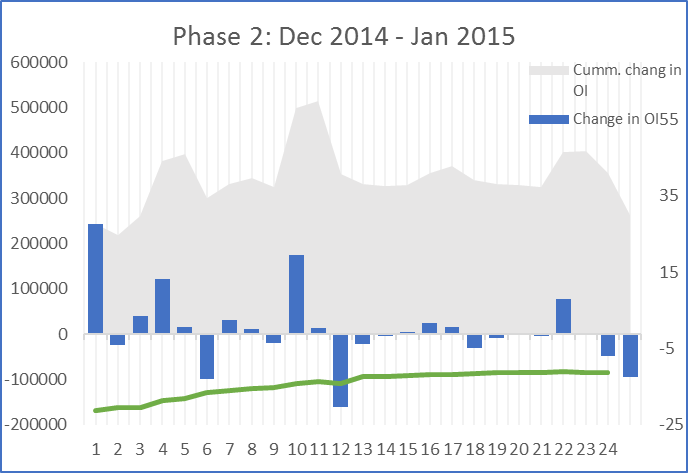
Most of the open interest was back in the first 7 months, we may have seen some of the reversals of the flows from Phase 1. Commercials traded with each other increasing both long and short positions, as did the hedge funds. The other possible relevant factor here, is that 70% of the volume over this period was between prices of $44 and $57/bbl.
Phase 3
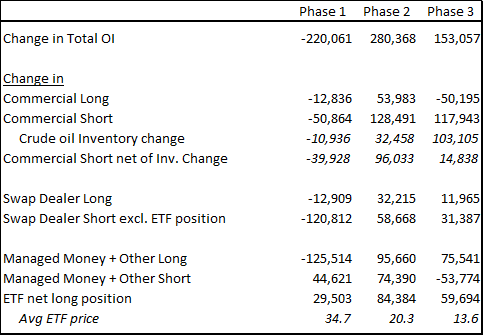
Phase 3 seemed to be a large consolidation phase. Commercial shorts did not sell much beyond inventory accumulations. Commercial longs seem to reduce length, possibly by not replacing hedges that rolled off. Most of the open interest increase is driven by hedge funds and ETFs adding to long positions, being matched with the inventory hedgers.
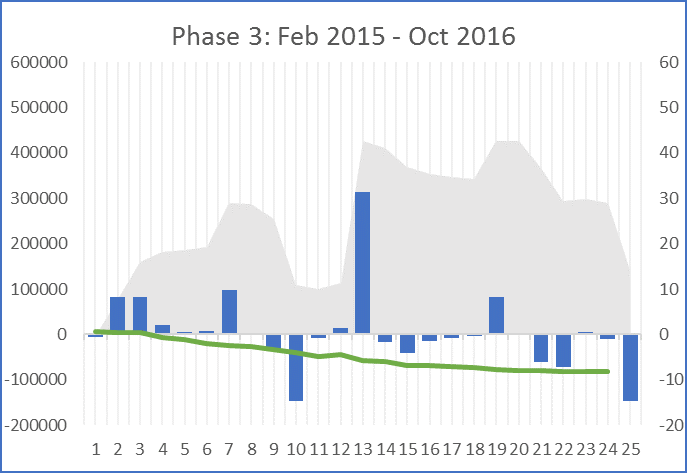
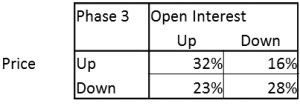
Within this wide band, prices were probably driven by long accumulation. Price changes correlated strongly with open interest changes, possibly because financial buyers incremental demand for futures drove price. When open interest decreased, the market was much more likely to drop than rally, suggesting further that long liquidation was driving price declines more often than not. Prices end the period mostly unchanged from the start of this period.
Phase 4
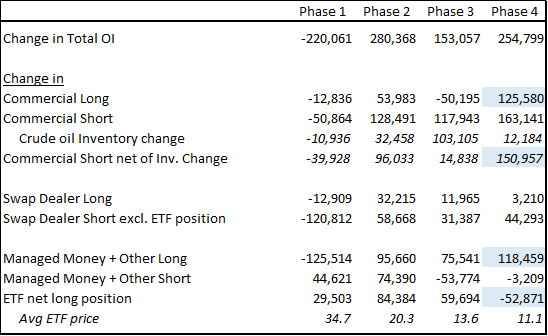
The trend of long accumulation driving market prices reverses in Phase 4. The first major change we notice is open interest is now decreasing in the front 7 months. About half of the 100k of so decrease among the first 7 months can be attributed to the reduced ETF long position. We would speculate this is could either be matched up with unwinds of excess inventory hedging or rolling back of managed money length further down the curve. It could not be matched up with commercial longs increasing as open interest would then increase in the front of the curve.
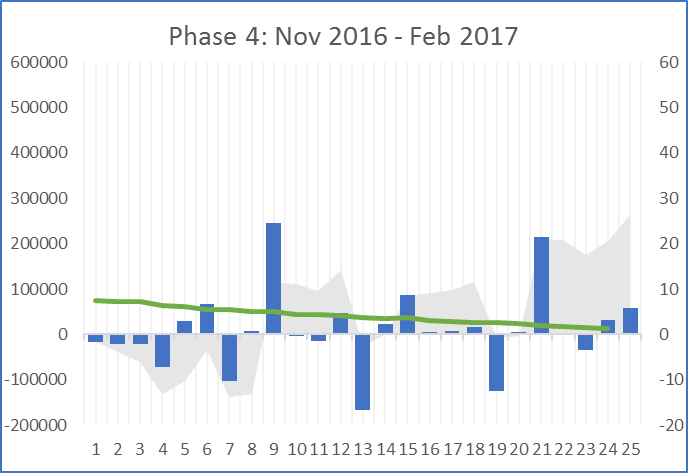
Commercial short positions in excess of inventory builds increased rapidly and was most likely matched up with commercial longs, most likely both in the back months of the curve. Essentially it seems that the price setting is now occurring in the back months of the curve, a symptom of large scale producer hedging.
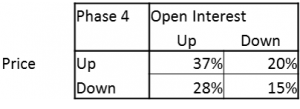
Furthermore, it seems that sellers are price sensitive and are parked at predetermined levels, close to the top of the band discussed in phase 2. Open interest increases on days when the market is up, as producers come in and sell. On days where open interest decresases, price is now more likely to go up than down, perhaps driven by inventory hedges being reduced, and the absence of a seller.
Also the ETF holders have largely reversed the flow from phase 3, with prices little changed.
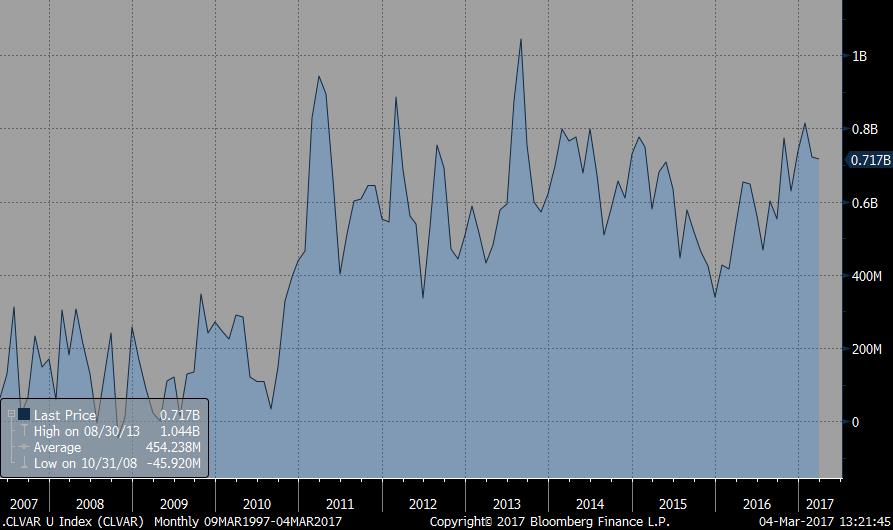
While there has been a lot of coverage of the extent of the net spec long in crude oil futures, it seems that the reality might be that there has been a large amount of producer hedging and this is forcing all other participants to take the other side. Total VAR (chart below) in the market is high, but is only 1 standard deviation over normal, if we look back 5 years. We don’t account for any changes in capital allocations to traders in the space.
Perhaps the market has found a true balance, where consumers are willing to trade with producers, more than we have seen in the past cycle. Also, perhaps prices being stuck in a tight range despite a lack of significant inventory hedge unwinds suggests that the market may be at a price low enough to supply the liquidity these commercial shorts need.
Aggregate
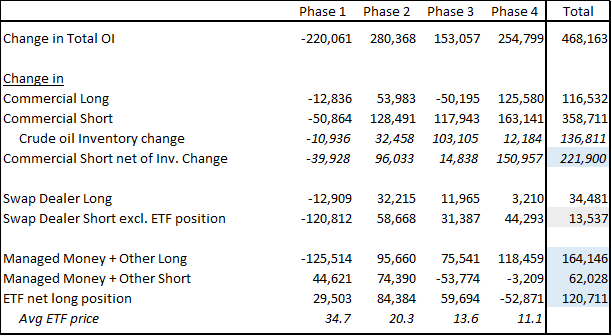
Looking at the changes in aggregate, the swap dealer short position excluding ETF position is pretty much back to where it was before the drop in 2014. Given US production volumes are not higher than the start of this cycle, it seems like we have re-established previous levels of hedge cover. Prices maintained equilibrium largely from late 2012 to mid 2014, and maybe this is a return to those conditions.
Commercials sellers have clearly driven the open interest higher, and while about a third of that is due to higher levels of inventory hedging as inventories built, most of it seems to be additional hedge cover. This has been picked up by consumers (commercial longs) and financial buyers (ETF and managed money).
Either way, we would keep a close eye on producer action, and any break out of this recent trading range would likely be signaled by the following effects.
To the upside, inventories draw and commercial shorts start to reduce positions, or producers stop hedging, and their short positions roll of with time.
To the downside, weaker data or fundamentals cause financial buyers to exit the market and prices move lower to find new buyers.
We will keep a close eye on open interest and commercial shorts.
PAST PERFORMANCE IS NOT NECESSARILY INDICATIVE OF FUTURE RESULTS. TRADING COMMODITY FUTURES AND OPTIONS IS SPECULATIVE, INVOLVES RISK OF LOSS, AND IS NOT SUITABLE FOR ALL INVESTORS. FOR QUALIFIED ELIGIBLE PERSONS (UNDER CFTC RULE 4.7) ONLY. THE STATEMENTS MADE ARE THE OPINIONS OF ITS AUTHOR, NIKHIL DHIR, AND ARE NOT TO BE RELIED UPON BY ANYONE AS THE BASIS FOR AN INVESTMENT DECISION. INFORMATION WAS PULLED FROM SOURCES BELIEVED TO BE RELIABLE, HOWEVER EXTENSIVE VERIFICATION PROCEDURES TO ENSURE DATA ACCURACY WAS NOT APPLIED.
